





The dividend discount model (DDM) is one of the oldest and best-known methods of valuing shares. It says that a share is worth the present value of all the dividends it will pay in the future. Some have praised it as objective and grounded in cash that investors actually receive.
But the model has serious weaknesses. Academics and practitioners have pointed out flaws that limit when and how it can be used, and relying on it blindly can lead investors to miss good opportunities or misjudge value.
Understanding these disadvantages helps investors know when the DDM is the right tool, when it needs to be supplemented, and when another model should be used instead.
This article explains the main disadvantages of the dividend discount model and some practical points every investor should consider before relying on it.
A Quick Refresher: How the DDM Works
In its simplest form, the Gordon growth model, the DDM values a share as:
Here D1 is next year’s expected dividend, r is the return investors require, and g is the constant rate at which dividends are expected to grow forever. More complex versions forecast dividends year by year for a period and then apply this formula to the years beyond.
Disadvantage 1: Limited Use
The DDM works best for mature, stable companies with a long record of paying dividends. That may sound like a strength, but it comes with a big trade-off: an investor who relies only on the DDM tends to miss high-growth companies.
Fast-growing companies have many opportunities to invest in new products and markets, and often need more cash than they generate. They raise money rather than pay it out, so they pay little or no dividend. The DDM struggles to value them.
Some of the world’s most successful companies paid no dividends for years. Microsoft paid its first dividend in 2003, almost three decades after it was founded. Alphabet (Google) and Meta (Facebook) only began paying dividends in 2024. An investor who could only value companies through current dividends would have struggled to value them during their years of fastest growth.
One workaround is to forecast when a growing company will mature and start paying dividends, and value it from there. But forecasting so far ahead is very difficult, and the further into the future the projections go, the less reliable they become.
Disadvantage 2: Dividends May Not Reflect Earnings or Value
The DDM assumes that dividends move in line with a company’s ability to create value. In practice, companies try to keep dividends smooth and steady, even when their earnings swing up and down.
Some companies have even borrowed money to keep paying dividends while their business struggled. In such cases, the dividend overstates the company’s real strength, and a model built on dividends will overstate its value. Dividends are a decision made by the board, not a direct measure of value creation.
Disadvantage 3: Too Many Assumptions, and Very Sensitive to Them
The DDM depends on assumptions about future dividends, growth rates and the required rate of return, all of which are uncertain and outside the investor’s control.
Worse, the model is extremely sensitive to small changes in these assumptions, because the value depends on the gap between r and g. Consider a company expected to pay a dividend of 5 next year, with a required return of 10%:
| Growth rate (g) | Value = 5 ÷ (0.10 − g) |
|---|---|
| 5% | 100 |
| 6% | 125 |
| 7% | 167 |
| 8% | 250 |
A change in the growth assumption of just three percentage points multiplies the estimated value by 2.5. If g is set equal to or above r, the formula breaks down altogether.
Disadvantage 4: Tax Effects
In many countries, the tax system makes dividends less attractive than other ways of returning cash. Capital gains may be taxed more lightly than dividends, or only when shares are sold, and share buybacks may be more tax-efficient for both companies and shareholders.
In such countries, many companies return cash through buybacks instead of dividends. A strict DDM investor would undervalue these companies, or have to ignore them altogether. Tax rules also change over time, which can alter dividend policies across a whole market.
In theory, how a company returns cash should not matter. The Modigliani-Miller dividend irrelevance theorem shows that, in a world without taxes or trading costs, a shareholder who wants cash can simply sell some shares. In practice, taxes create “clienteles”: groups of investors who prefer dividends or capital gains depending on their tax position. Companies shape their payouts to suit them, and because the DDM counts only dividends, it understates the total cash returned by companies that rely on buybacks.
Disadvantage 5: Irrelevant for Controlling Shareholders
Large shareholders with enough influence to change a company’s dividend policy, or a buyer acquiring the whole company, are not limited to the dividends the board decides to pay. For them, what matters is the cash the company can generate. Free cash flow models are a better fit for these investors.
Disadvantage 6: A Long-Term Model That Can Test Patience
The DDM is a tool for long-term investors. It is not designed to pick stocks that will beat the market every year. Shares that look cheap on a dividend basis can stay cheap for years before the market recognizes their value, if it ever does.
Investors using the DDM therefore need patience and the financial strength to ride out long periods of underperformance. Someone who may need to sell at short notice could be forced out at a bad time, turning a paper loss into a real one.
Disadvantage 7: A Bias Toward Certain Kinds of Stock
Because the DDM gives most weight to dividends in the near future, it tends to favor companies with high dividend yields and low price-to-earnings ratios. Some analysts have found that the stocks recommended by elaborate DDM analysis look much like the stocks a simple screen for high yields and low P/E ratios would select.
The risk is that investors miss companies that do not fit this profile but go on to deliver exceptional returns. A high dividend yield can also be a warning sign: sometimes a yield looks high only because the share price has fallen sharply, and the dividend may soon be cut.
A Checklist Before Using the DDM
- Does the company have a long, stable record of paying dividends?
- Is its payout ratio likely to stay steady, rather than swing with earnings?
- Is the long-term growth rate realistic and clearly below the required return?
- Does the company return cash mainly through dividends, rather than buybacks?
- Are you valuing a minority stake rather than a controlling one?
If the answer to most of these is no, the DDM should at best be used alongside other models. Common warning signs include:
- A dividend yield far above the company’s own history or its peers.
- Dividends paid out of borrowed money rather than earnings.
- A payout ratio above 100% of earnings for several years.
Practical Guide: How to Spot a Dividend Trap
A high dividend yield can signal a bargain, but it often signals trouble: the share price has fallen because investors expect the dividend to be cut. These four checks help separate safe dividends from traps.
- Check that free cash flow covers the dividend:

A ratio below 1 means the company is paying out more cash than it generates for shareholders and is funding the gap from its cash reserves or new borrowing. - Check the payout ratio:
Payout ratio = Dividends per share ÷ Earnings per share
As a rule of thumb, a payout ratio above about 85% leaves little room for a bad year, except in very stable businesses such as regulated utilities. - Check the debt: As a rule of thumb, net debt above about 3 to 3.5 times EBITDA is high for most companies. In a downturn, lenders may require the company to cut its dividend to protect them.
- Check that the company is still investing: Compare capital spending with depreciation. If the company keeps paying generous dividends while spending well below depreciation for several years, it may be running down its assets to fund the payout.
When the DDM Works and What to Use Instead
| Situation | Is the DDM suitable? | Better alternative |
|---|---|---|
| Mature company with stable, predictable dividends | Yes | (DDM works well; cross-check with multiples) |
| Fast-growing company paying no dividend | No | Free cash flow or residual income model |
| Company returning cash mainly through buybacks | Limited | Free cash flow to equity model |
| Investor buying a controlling stake | No | Free cash flow to the firm model |
| Bank or insurer with steady payouts | Often yes | Residual income model as a cross-check |
Conclusion
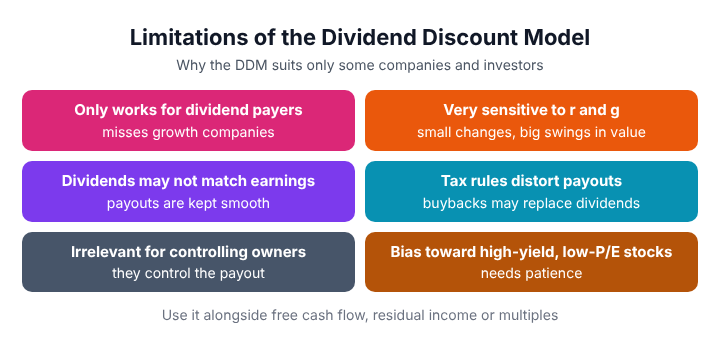
The dividend discount model is a useful and logical way to value shares, but it has clear limitations. It works poorly for companies that pay little or no dividend, depends heavily on uncertain assumptions, can be misled by dividends that do not reflect true earnings, is affected by tax rules, and is less relevant to controlling shareholders. It also suits patient, long-term investors more than those who need quick results.
Many investors treat the DDM as the gold standard, but it is really the right tool for a particular kind of company and investor. Used alongside other models, and with its weaknesses in mind, it remains a valuable part of the analyst’s toolkit.
Frequently Asked Questions
What are the main disadvantages of the dividend discount model?
It cannot easily value companies that pay little or no dividend, it is highly sensitive to growth and discount rate assumptions, dividends may not reflect a company’s true earnings, tax rules can distort dividend policy, and it is less relevant to controlling investors.
Why can’t the DDM value growth companies?
Growth companies usually reinvest their cash rather than pay dividends. With little or no dividend to discount, the model gives an unreliable value unless the analyst forecasts far into the future.
Why is the DDM so sensitive to assumptions?
Because the value depends on the difference between the required return and the growth rate. When that gap is small, even a tiny change in either figure causes a large change in the estimated value.
What happens if the growth rate is higher than the required return?
The Gordon growth formula stops working, because it would imply an infinite or negative value. The model only works when the required return is greater than the growth rate.
What should be used instead of the DDM?
Free cash flow models, residual income models and relative valuation using multiples are common alternatives, depending on the company and the investor.